Home What We Do The Framework Outcomes Who We Are Partners The AI Decision Take A Tour →
Outcomes

A Report Tells You What's Wrong.
An Outcome Changes the Business.

Almost every organization can buy an AI assessment. Very few can point to what changed because of it. Cogitant is built around the difference — a quantified outcome, tied to a sequenced plan, where every action is accountable to the value it creates.

Most AI Initiatives
Produce Nothing.

95%
of generative-AI projects deliver no measurable business return — despite $30–40B of enterprise investment. Not because the technology failed, but because the work was never tied to a business outcome.MIT Project NANDA · The GenAI Divide: State of AI in Business, 2025

The failure is almost never technical. It's structural — and it repeats in three predictable ways.

No definition of success

The initiative starts with a tool rather than a number. Nobody agreed in advance what "working" would look like, so nothing can be proven afterward.

No sequence

Everything is attempted at once, or the flashiest thing goes first. The foundations that would have made it stick were never laid, so the pilot stalls.

No line to value

Activity gets reported instead of outcomes. Leadership can see effort and spend, but can't see which part of the business is measurably better.

Every Action, Accountable
to the Value It Creates.

Cogitant frames AI value in four pillars — the same four we bring to every engagement. Every action in your roadmap is tagged with the value it creates, so the plan reads as value being captured rather than work being done.

Productivity
More from the people you have
Productivity

Doing more with the people you have. AI absorbs repetitive work so your team's time shifts to higher-value effort — the judgment, relationships and problem-solving your clients are actually paying for.

What it looks like: the highest-paid people in the building stop spending hours a week on work a well-trained system could draft or triage first — and that capacity is redeployed rather than simply absorbed.
Efficiency
The same work, less friction
Efficiency

Doing the same work with less friction, waste, and rework — streamlined processes and better-quality data. This is the operational drag AI removes most reliably, and it's usually where the fastest wins live.

What it looks like: cycle times shorten, handoffs stop dropping work, and the data your team needs is in one governed place instead of scattered across inboxes and drives.
Protect / Grow Market
Defend and expand your position
Protect / Grow Market

Defending and expanding your competitive position — retaining clients, opening new revenue, and building durable advantage. This is the pillar that shows up latest in the financials and matters most to the long run.

What it looks like: you meet the expectations AI-informed customers now arrive with, you match AI-enabled competitors on responsiveness and price, and you launch offers that weren't profitable before.
Cost Savings
Direct cost avoidance
Cost Savings

Direct cost avoidance — lower spend on the work AI can absorb, and disciplined governance of what AI itself costs to run. The second half matters: unmanaged AI spend quietly erodes the savings the first half produced.

What it looks like: cost-to-serve falls, spend that was scheduled never gets committed, and the compliance and rework costs that would have surfaced never materialize because the foundations hold.

The coverage view is the insight

Most actions advance more than one pillar. Reading the roadmap by pillar shows where your plan concentrates its value — and where it under-serves a pillar, which is often the clearest opportunity to broaden the work. A thin pillar isn't a gap in the report. It's value your strategy hasn't gone after yet.

Three Numbers
That Move a Board.

Scores start the conversation; dollars finish it. Every engagement produces a quantified view of what's at stake, what's available, and how long you have — expressed as ranges, because that is what the evidence honestly supports.

▲ Revenue at Risk
If you wait

What your current exposure puts in play over an 18-month horizon — the revenue that becomes vulnerable if the gaps stay open while competitors move.

▲ AI Capture Opportunity
Per year

The annual value available to you across the four pillars if the plan is executed well — with the top value plays named and ranked.

▲ Competitive Window
How long

How much time you realistically have before positions harden in your industry — the clock that decides sequencing.

How the numbers are built. The opportunity model is deliberately simple enough to argue with:
revenue × automatable share × realistic capture
applied per value driver and calibrated to your industry. We show the inputs, not just the answer — because a credible-but-conservative number that survives a CFO's first challenge is worth more than an optimistic one that doesn't.

Advantage-Targeted.
Risk-Gated.

The plan doesn't start with what's broken. It starts with your highest-value advantage play, fixes only the exposures that block it, and runs everything else in parallel — so risk repair and value capture happen in one sequence rather than two competing projects.

01 · Position

The quadrant sets the posture

Your two scores place you: Execute Now, Foundation First, Advisory, or Stabilize First. The quadrant decides the sequence — what to do first, not just what's wrong.

02 · Gate

Fix what blocks the play

Not every risk goes first — only the exposures that gate your first advantage play. The rest runs as parallel governance, not a two-year prerequisite list.

03 · Sequence

Capture value in order

Advantage plays land biggest-and-fastest-payoff first, phased across three horizons — each phase funding confidence in the next.

04 · Tag

Show where each move pays

Every action carries the pillars it advances, so leadership reads the plan as value being captured — and can see instantly where the plan is thin.

Phase 1 · Fix the risk
Stabilize the foundations
0–90 days
  • Define the measurable AI outcome — revenue, cost, speed or quality
    EfficiencyCost
  • Consolidate data into one governed source of truth
    EfficiencyCost
  • Put guardrails on AI use — policy plus role-based training
    Protect / GrowProductivity
Phase 2 · Capture value
Deploy the first advantage play
3–9 months
  • Automate the highest-volume work your experts shouldn't be doing
    ProductivityEfficiencyCost
  • Redeploy the reclaimed capacity to higher-value work
    ProductivityProtect / Grow
Phase 3 · Build advantage
Compound the moat
9–24 months
  • Turn accumulated history into decision intelligence
    EfficiencyProtect / Grow
  • Launch AI-enabled offers that weren't viable before
    Protect / Grow

Board-Ready
the Same Week.

Not a dashboard to interpret — a set of documents built for the specific rooms your decisions get made in.

Executive One-Pager

The headline on a single page: both scores, the revenue at stake and the opportunity, your biggest exposures, and the recommended first move.

For the board packet

AI Value & ROI Brief

Where AI creates the most value for you, quantified as a range, with the top plays and the sequence to capture them.

For the CFO conversation

Full Narrative Report

Every dimension scored and explained, your gaps in your own words, and the complete prioritized roadmap with all actions tagged to pillars and phases.

For the leadership team

Executive Deck

The presentation version — scores, position, value coverage and the phased plan, ready to walk a room through without rebuilding slides.

For the all-hands or board meeting

Integrated Result

The risk × advantage snapshot: both scores, your strategic position on the quadrant, and the revenue at stake — at a glance.

For the working session

Facilitator Workbook

Every question, answer and comment captured during the session — the audit trail behind each score, so the reasoning survives the meeting.

For your record
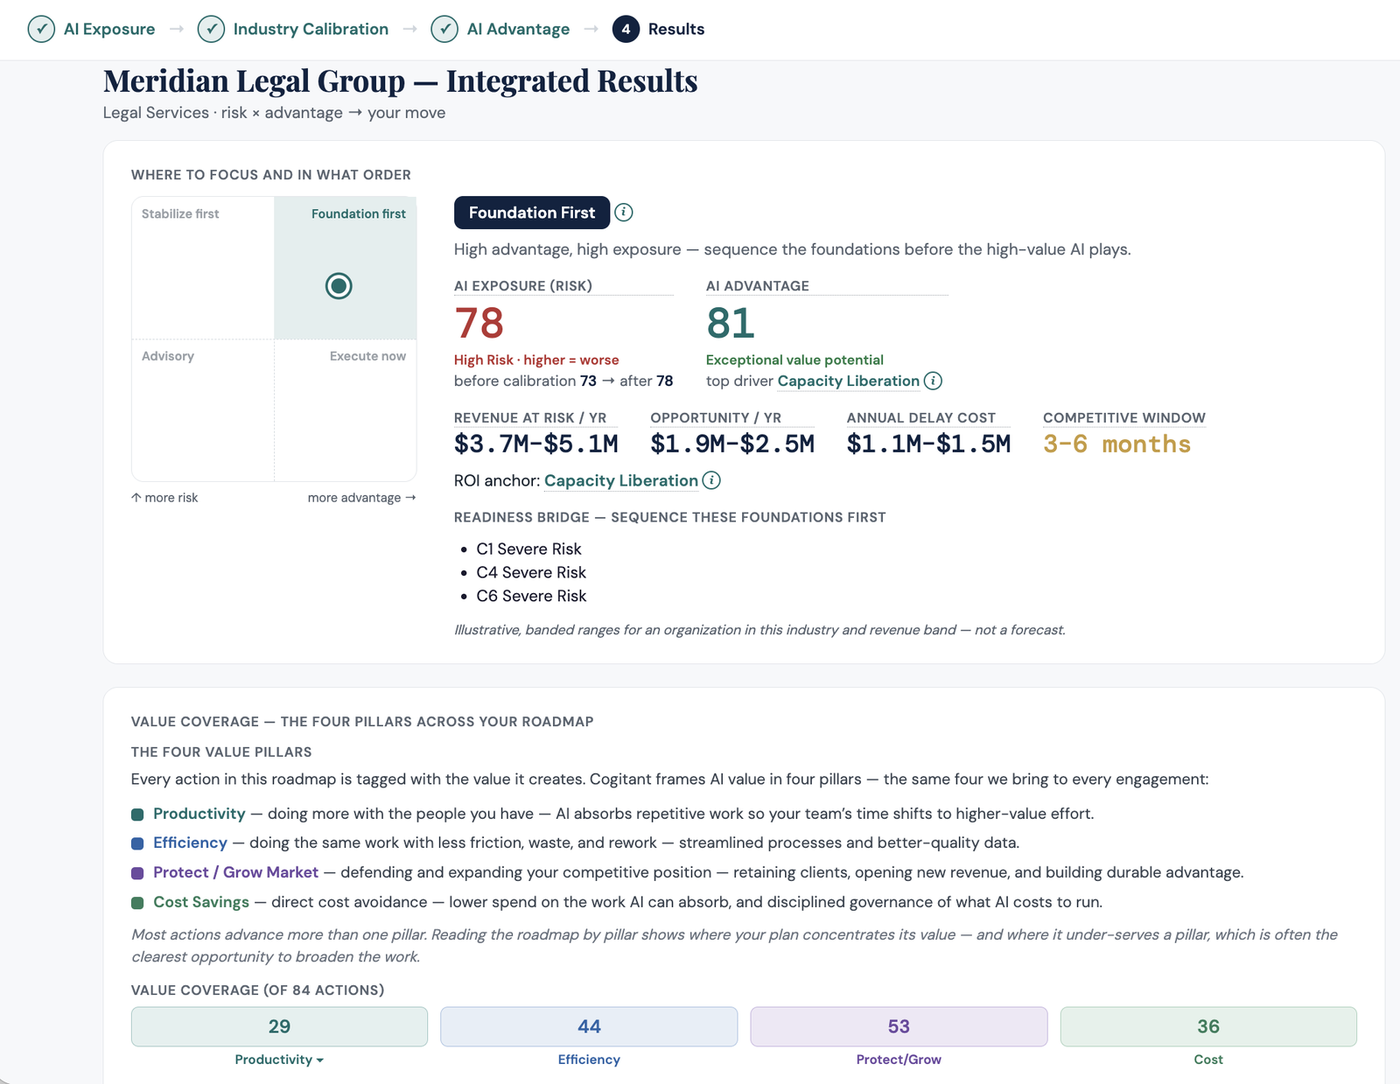
Integrated results screen showing AI Exposure and AI Advantage scores, the strategic position quadrant, revenue at risk and opportunity, and the four-pillar value coverage
View Full Size →
Risk × Advantage Snapshot
Both scores, your strategic position, the revenue at stake — and how your plan covers the four value pillars
Legal Services sample
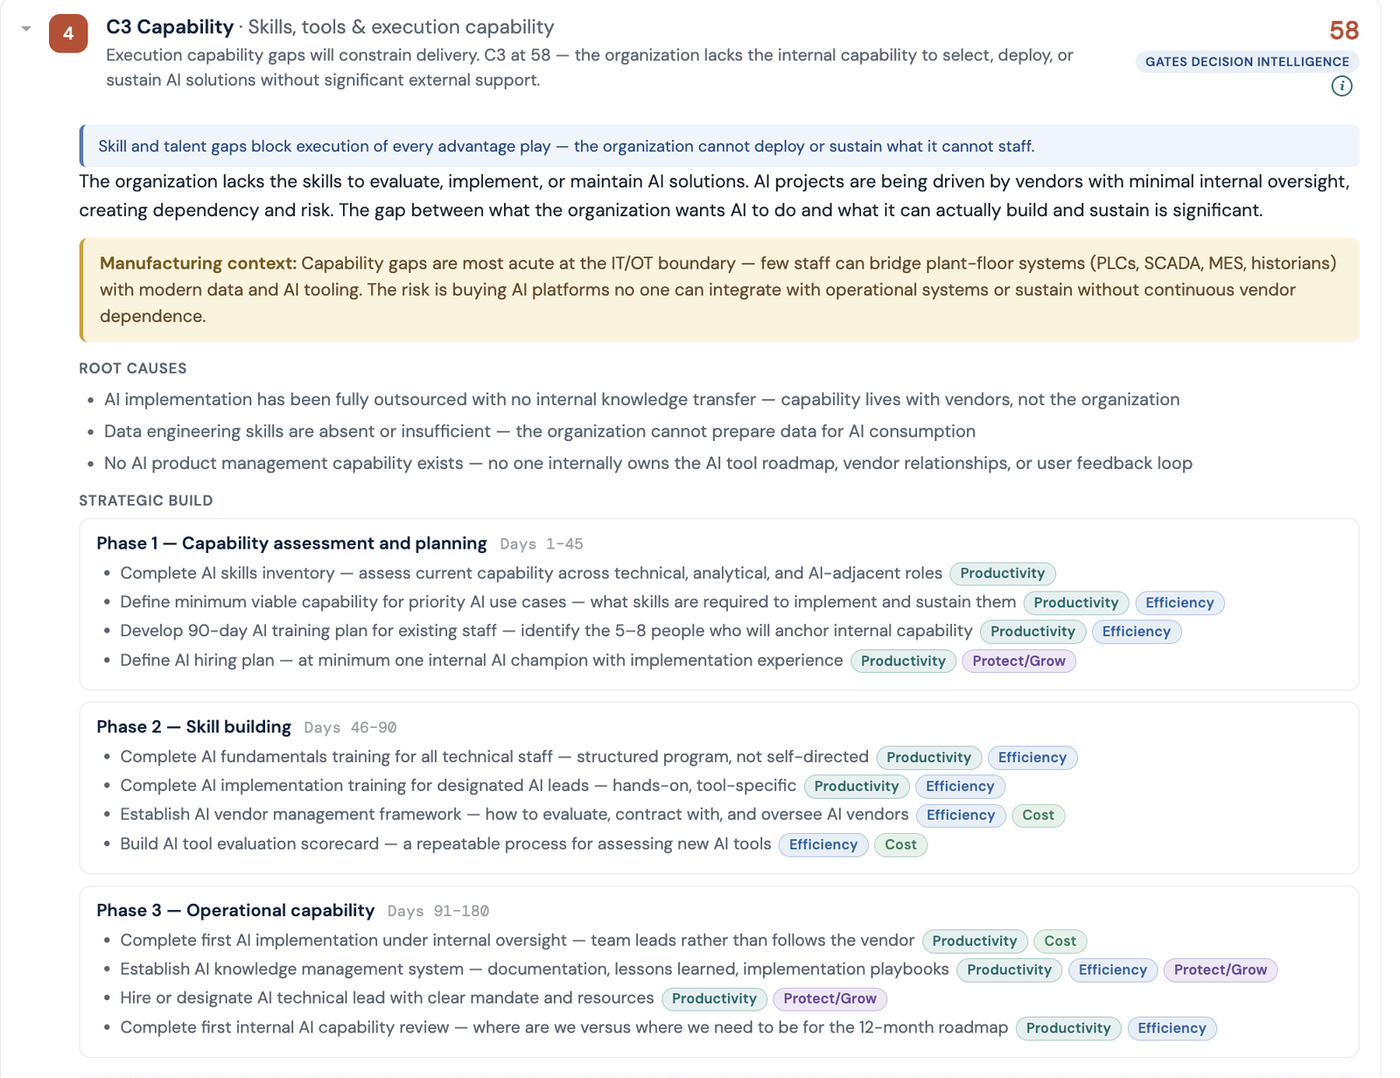
Priority roadmap showing phased milestones with each action tagged to the value pillars it advances
View Full Size →
The Priority Roadmap
Phased, sequenced actions — every one tagged to the value pillars it advances
Manufacturing sample
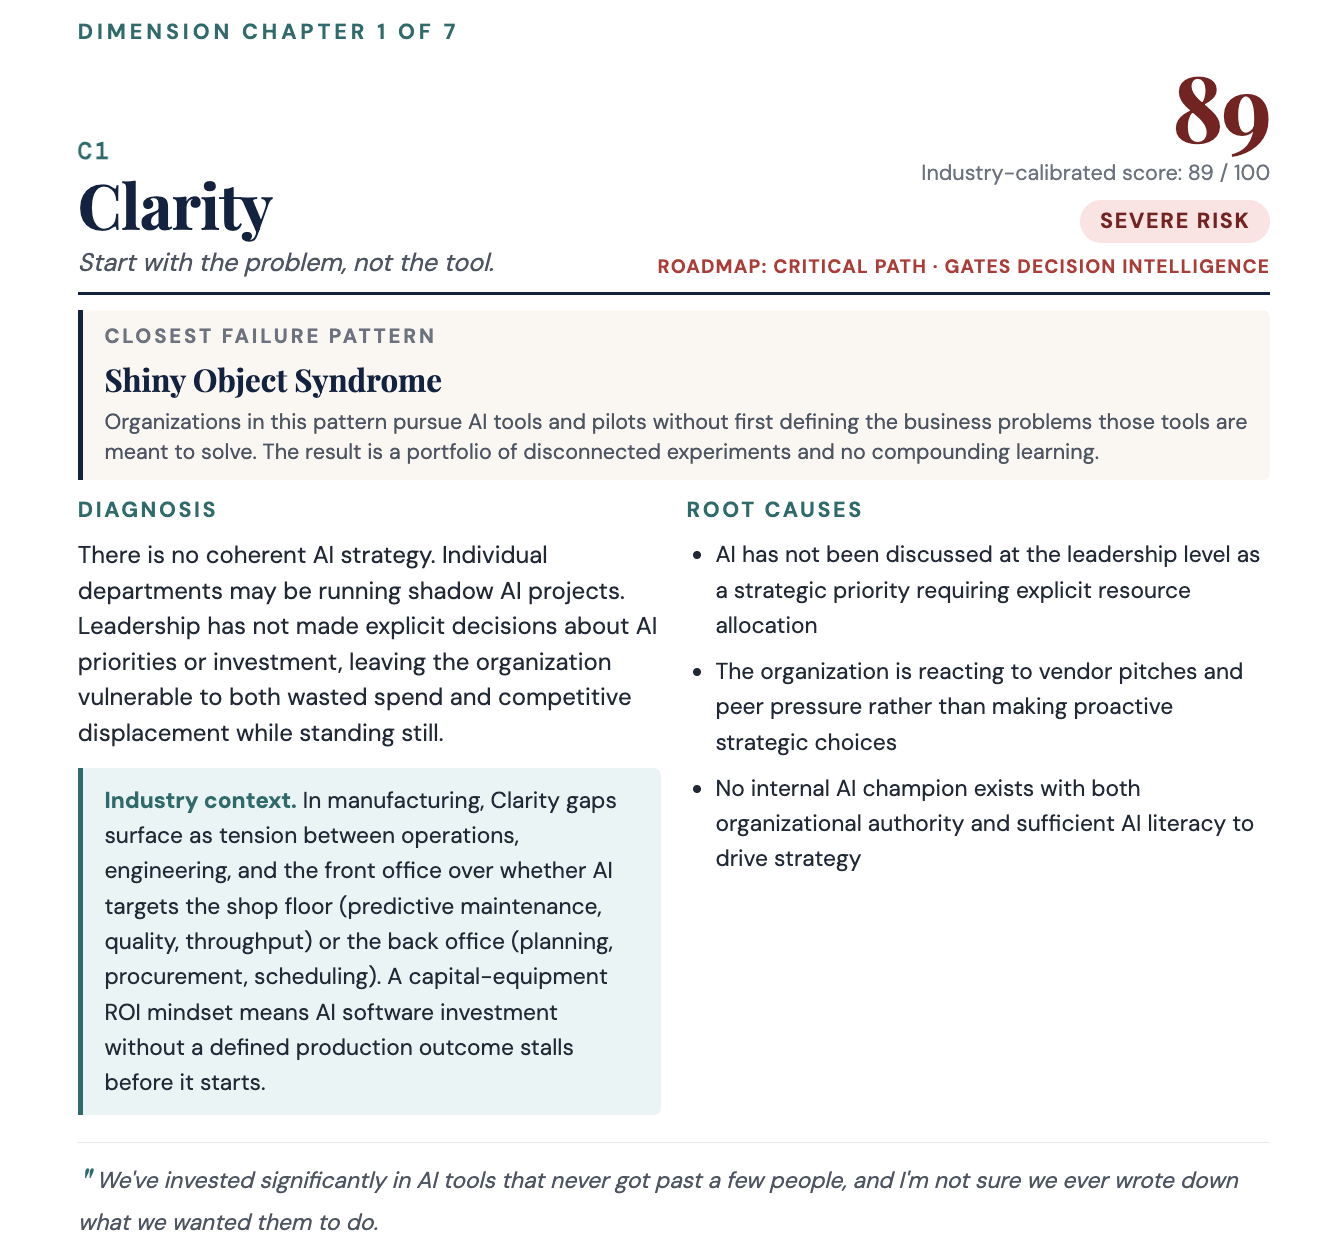
Full report dimension chapter showing the closest failure pattern, diagnosis, root causes and industry context
View Full Size →
The Full Report
Every dimension: the failure pattern, the diagnosis, the root causes — and your gaps in your own words
Manufacturing sample
Take the full 2-minute tour →

These are static previews — the interactive tour walks through the full risk × advantage story end-to-end.

The Re-Measure Is
the Proof.

An outcome you can't verify is just a claim. Because the diagnostic produces a structured score, it can be re-run — and the second number is where the accountability lives.

Baseline

Your first engagement sets the mark: both scores, the gaps, the quantified stake, and the sequenced plan. Everything afterward is measured against it.

Re-assess

Run the diagnostic again on the same instrument. Movement in the scores — by dimension and by pillar — shows what the work actually changed.

Reset the plan

The gap landscape shifts as you close it. Each cycle resurfaces what's now highest-value, so the roadmap stays current instead of aging on a shelf.

What we won't claim

Every dollar figure the Index produces is an illustrative, directional estimate from a structured expert model calibrated to industry research — not an audited result, a guarantee, or a forecast. We label ranges as ranges and we say plainly what the model does and doesn't know. We are rigorous about evidence and deeply skeptical of both AI hype and AI denial. The method is published, so you can argue with it.

See what the outcome
looks like for you.

One facilitated engagement produces both scores, the quantified stake, and a plan your leadership can act on the same week.

See the Framework